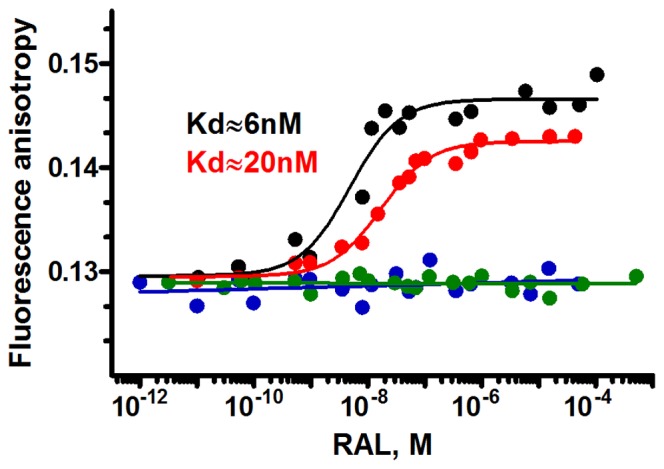
Figure 4. Quantitative analysis of RAL binding to oligonucleotides.

Fluorescence anisotropy titration of the four oligonucleotides LTR32 (black), LTR34 (red), LTR32-I (blue) and LTR30 (green) at 20 nM by increasing concentrations of RAL (from 10−12 M to 10−4 M). Kds obtained from titrations of LTR32 and LTR34 at 20 nM are indicated near the corresponding curves.
