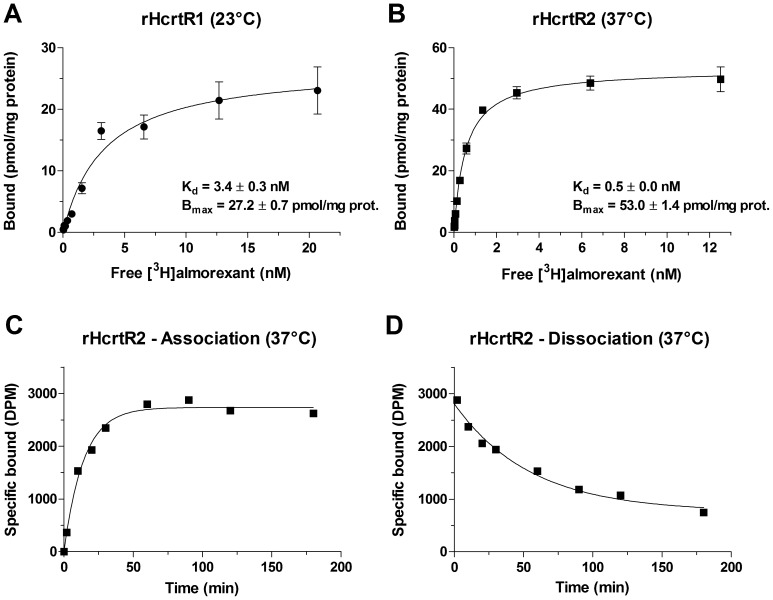
Figure 1. Binding characteristics of [3H]almorexant to rHCRTR1 and rHCRTR2 cell membranes.
(A,B) Saturation binding curves of [3H]almorexant binding to membranes from HEK293 cells transiently transfected with rHCRTR1 (A) or rHCRTR2 (B). Each data point represents the mean±SEM of three independent experiments performed in triplicate. The data were analyzed by nonlinear regression analysis using GraphPad Prism 4.0 software and a single-site binding model. (C,D) Time course for the association (C) and dissociation (D) of [3H]almorexant binding to rHCRTR2 membranes.

