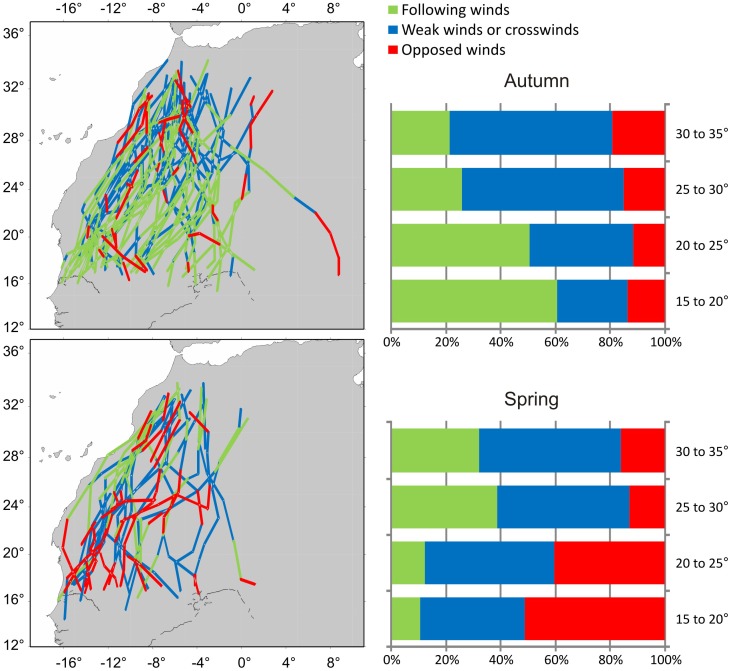
Figure 6. Spatial and temporal variation of wind assistance (all species pooled).
The maps show daily segments. Colours indicate the extent of wind support: green = tailwind (>2.5 m/s), blue = weak wind (2.5 to –2.5 m/s), red = headwind (< –2.5 m/s). The bars show the frequency of different tailwind classes in different latitudinal bands.

