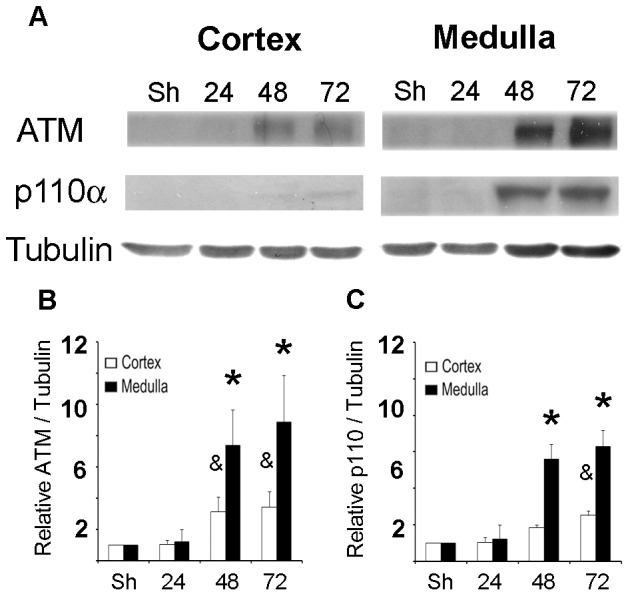
Figure 10. NFAT5-regulators protein, ATM and PI3K, were induced in post-ischemic kidneys.

ATM and PI3K (p110α) protein abundance was measured by Western blot in cortex or medulla from rat kidney. A. A representative picture is shown in the upper section (n = 5). B. Relative ATM abundance. C. Relative p110α abundance. Bar graph represents Mean ± SEM. * or & indicates P<0.05; n = 5 (* vs sham medulla & vs sham cortex).
