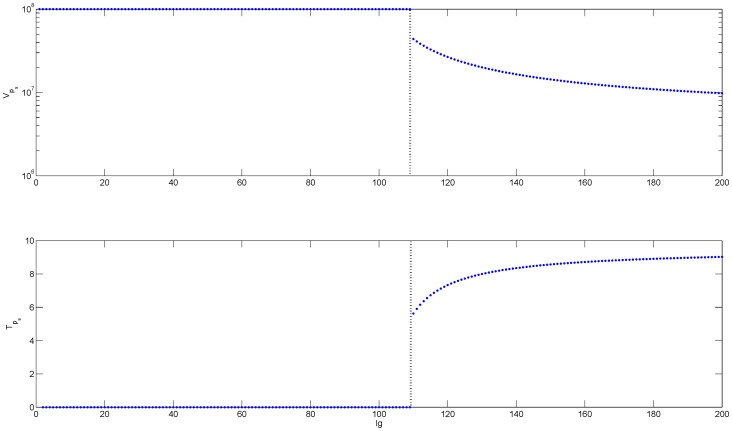
Figure 2. Bifurcation diagrams showing the change in the steady states of HBeAg-positive virus (top panel) and HBeAg-specific T-cells (lower panel) as a function of antibody levels (Ig) for  . We used the parameter values listed in table 1,
  and
and  .
.
The values for  and
and  are given by steady state values
  for
for  and
and  for
for  , and the transition from tolerance to immune activation at
  is marked by vertical lines.

