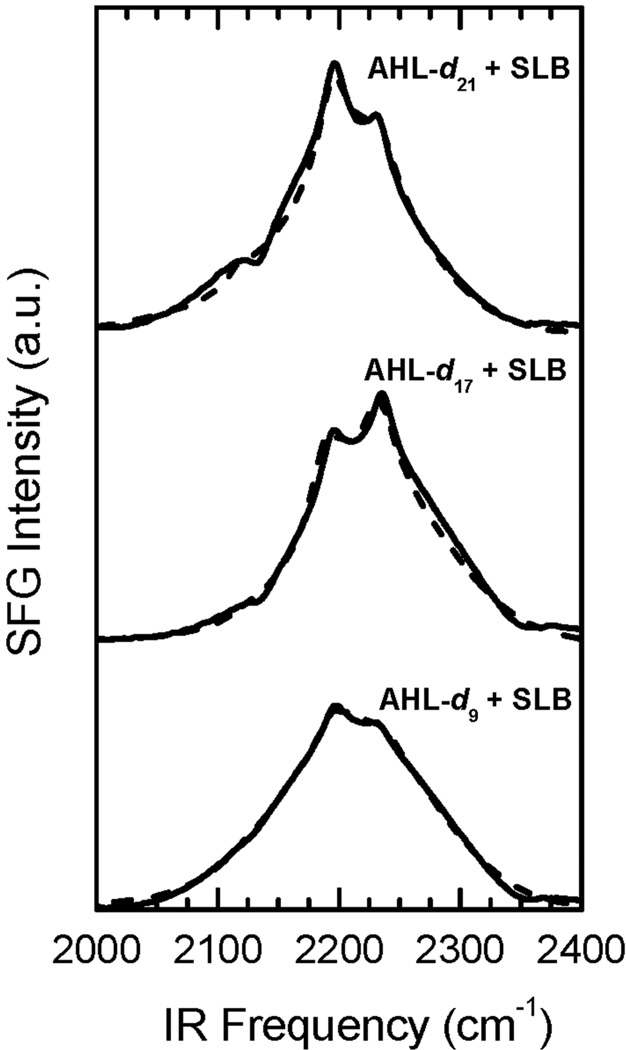
Figure 4.
Non background-suppressed SFG spectra of incorporated AHL-d9, AHL-d17, and AHL-d21. The envelope reflects the non-resonant signal of the Au layer with a Gaussian-like IR intensity profile. The r− band located at 2220 cm−1 has a constructive relative phase to the non-resonant background resulting in a peak in the spectrum. The appearance of a peak in the spectrum is an indicator for a deuterated methyl group pointing towards the surface. Fits of the spectra are plotted as dotted lines.

