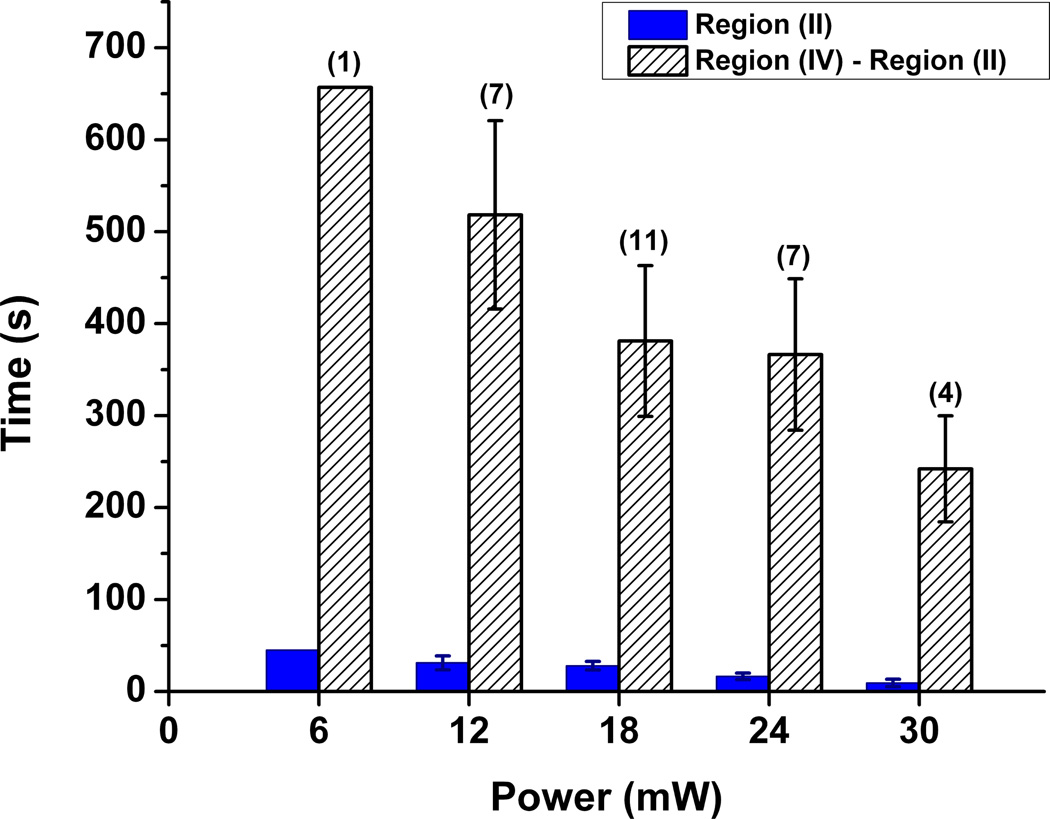
Fig. 4. Power-dependence studies.
The two-bar graph represents the time it takes for the release of PI from Azo-NP (solid) and for the released PI molecules to intercalate with nuclear DNA (striped). The computed error bars are standard error of the mean. The numbers on top of the bars represent the number of trials performed at a particular power setting.

