
Figure 10.
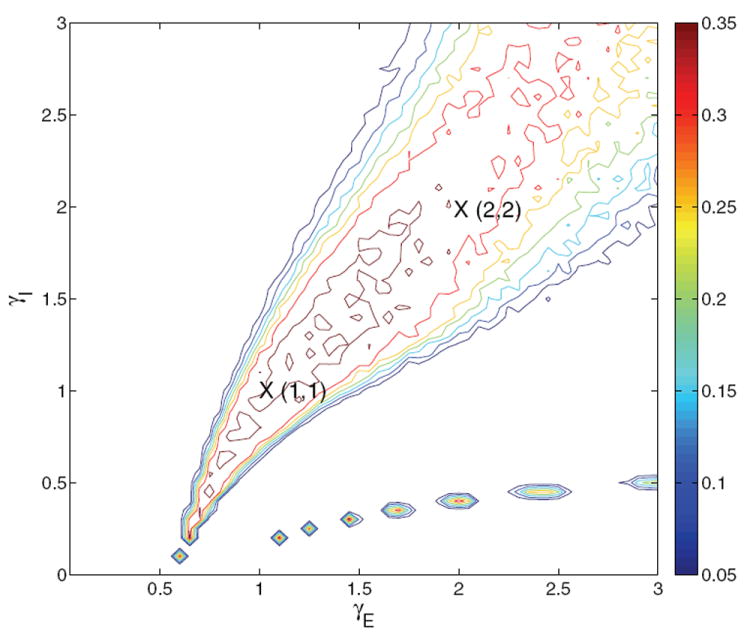
Contour map of reward rate over the glutamatergic-GABA-ergic (γE, γI) gain modulation plane for the two-population model with f-I curve ϕE,b for selective populations and ϕ3 = const over part of the region and linearly varying over the rest, as described in text. Remaining parameters are as in the four-population model with ϕE,b, and original derived currents are retained. Crosses identify gain pairs for which bifurcation diagrams are shown in Figures 11-12. Compare with Figures 1(a) and 4(b). The chain of islands in the lower right is due to the determinant Γ, defined in Appendix C.2, passing through 0 as explained in Appendix C.4.