
Figure 12.
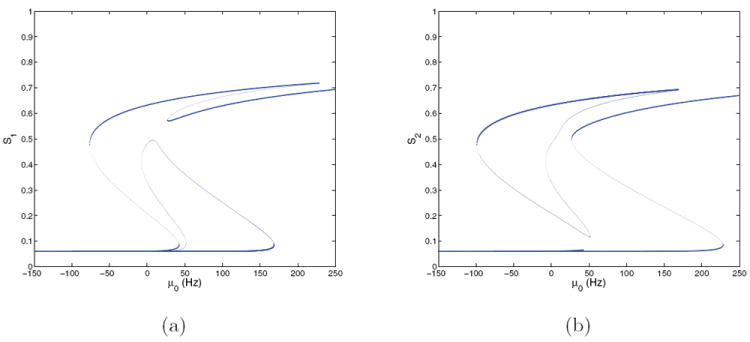
Bifurcation diagrams for the two-population model with E = 0.128 at (γE, γI) = (1, 1); cf. Figure 10. (a) S1 versus μ0; (b) S2 versus μ0. Stable branches are shown in bold.
Official websites use .gov
A
.gov website belongs to an official
government organization in the United States.
Secure .gov websites use HTTPS
A lock (
) or https:// means you've safely
connected to the .gov website. Share sensitive
information only on official, secure websites.
Bifurcation diagrams for the two-population model with E = 0.128 at (γE, γI) = (1, 1); cf. Figure 10. (a) S1 versus μ0; (b) S2 versus μ0. Stable branches are shown in bold.