
Figure 2.
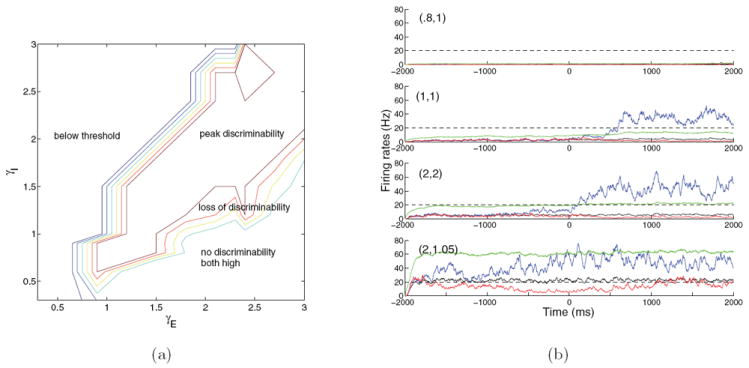
(a) Behavior of the spiking model over an expanded neuromodulation plane visualized through a plot of the relative separation between poststimulus firing rates of the two selective populations. In the below threshold region both selective populations remain subthreshold. In the peak discriminability region neural activities of the selective populations split, with one population crossing threshold and suppressing the other. Moving right and downward, impulsivity rises as excitation increases and inhibition drops, and eventually both populations approach high firing rates and pooled inhibition is insufficient to suppress any excitatory population, leading to loss of discriminability. (b) Firing rate traces illustrating different outcomes: subthreshold activity ((0.8,1), below threshold), optimal splitting ((1,1), peak discriminability), impulsive but still splitting ((2,2), upper-right peak discriminability) behaviors, and partial failure of pooled inhibition ((2,1.05), loss of discriminability). In the no discriminability, both high region all excitatory firing rates are approximately equal and very high (not shown in (b)). Traces show populations 1 (blue), 2 (red), 3 (black), and I (green); dashed lines indicate decision thresholds; stimulus onset is at time zero; (γE, γI) values are given at top left.