
Figure 3.
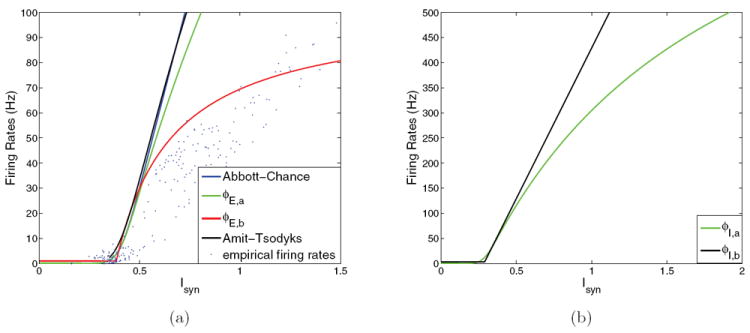
Input-output functions used in reduced models. (a) Pyramidal cell f-I curves: ϕLIF ((21), black) and ϕAC ((22), blue, as used in [49]); note that curves almost coincide; ϕE,a ((23), green) and the empirical ϕE,a ((24), red), compared with results from spiking model (blue dots). The empirical results shown (blue dots) were obtained by simulation of the full spiking network under different (γE, γI) conditions and averaging population firing rates over a 500 ms window once firing rates approached equilibrium. The average firing rates were then input into (11)-(14) to calculate the effective input currents Isyn. (b) Inhibitory cell f-I curves: ϕI,a (green, also given by (23); note saturation at 1/τref) and ϕI,b ((25), black). Parameter values are given in Appendix A.