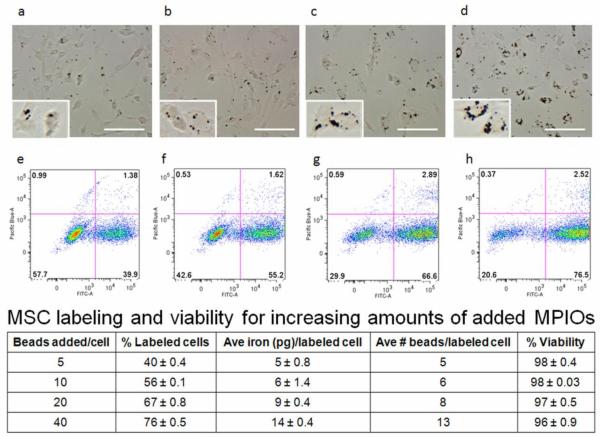
Figure 1.
Bright field photomicrograph and corresponding flow cytometry plot for rat MSCs labeled with a,e) 5 beads/cell b,f) 10 beads/cell c,g) 20 beads/cell and d,h) 40 beads/cell. Insets are magnified images of a small number of cells containing internalized beads for each labeling condition, with MPIOs shown in black in a-d). The FITC-A channel displays MPIO cell labeling and the Pacific Blue-A channel displays viability. The table shows MSC labeling and viability for increasing amounts of added MPIOs/cell; the values presented are mean ± standard deviation. Scale bars shown are 100 μm.

