Figure 4.
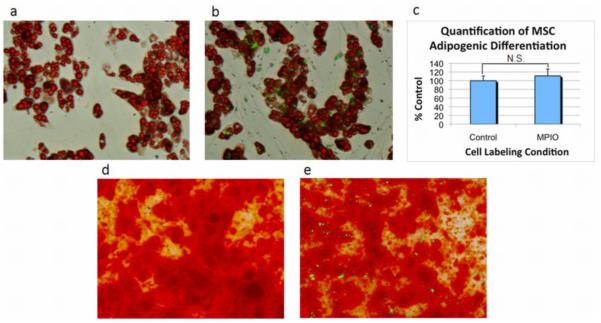
Bright field photomicrograph with fluorescence overlay of adipogenic and osteogenic differentiation of unlabeled and MPIO labeled MSCs. Oil red o staining confirmed adipogenic differentiation of a) unlabeled and b) MPIO labeled MSCs. The degree of adipogenic differentiation for cells with and without endocytosed particles was quantified using ImageJ and is shown in c). N.S. indicates not significantly different. Alizarin red staining confirmed osteogenic differentiation of d) unlabeled and e) MPIO labeled MSCs. MPIOs are shown in green.

