
Figure 2.
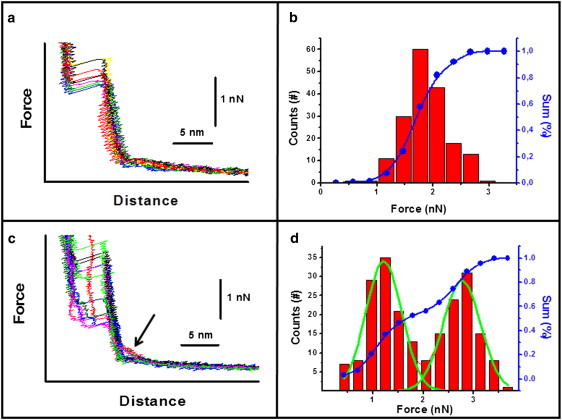
(a) Force curves obtained on a POPG bilayer at 27°C and tip speed of 598 nm/s. (b) Jump-through force values distribution corresponding to the case in panel a. (c) Force curves obtained on the same POPG bilayer as in panel a, but at 24°C. The arrow points to the region of the force curves in which the electrostatic interaction is increased. (d) Jump-through force values distribution corresponding to the case in panel c.