
Figure 2.
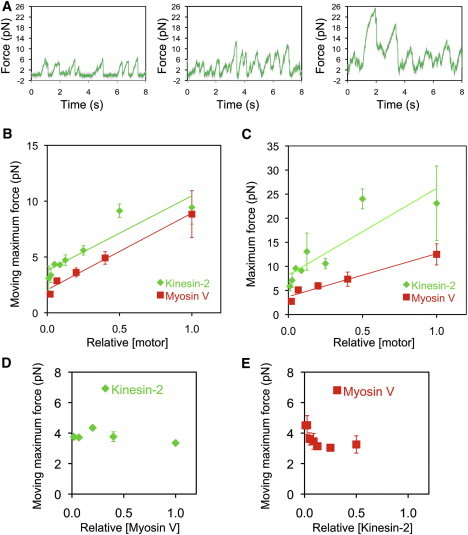
Kinesin-2 force scales with motor number and is not modified by myosin-V motors bound to the same bead. (A) Representative force traces for beads incubated with increasing concentration of kinesin-2 and a constant concentration of myosin-V. (B and C) Moving-maximum forces are shown in B and maximum forces are shown in C for beads with both kinesin-2 and myosin-V bound. Shown in green are force data from beads incubated with increasing concentrations of kinesin-2 motors, with myosin-V concentration held constant. Shown in red are force data from beads incubated with increasing concentrations of myosin-V, with kinesin-2 concentration held constant. Relative [motor] was normalized to the highest motor/bead ratio examined, corresponding to 7.3 × 10⁴ motors incubated per bead for kinesin-2 and 7.0 × 10³ motors incubated per bead for myosin-V (see Materials and Methods for more details). Each data point represents the average moving-maximum force produced per bead in a median filtered (window = 201) force trace; n = 1–7 beads for kinesin-2 data points and 1–7 beads for myosin-V data points. (D) Moving-maximum forces for kinesin-2 (at fixed loading) are plotted versus the relative loading concentration of myosin-V; normalized to 1 for a loading concentration of 7.0 × 10³ motors incubated per bead for myosin-V. (E) Moving-maximum forces for myosin-V (at fixed loading) are plotted versus the relative loading concentration of kinesin-2; normalized to 7.3 × 10⁴ motors incubated per bead for kinesin-2. Moving-maximum and maximum force measurements are plotted as mean ± SEM.