
Figure 1.
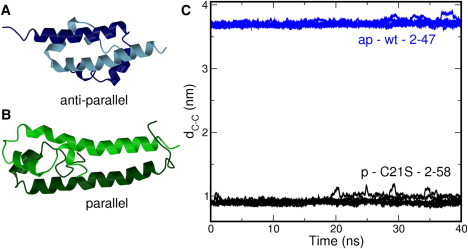
Ribbon representations of the structural data for the H-NS dimerization domain (A) the antiparallel conformation (B) the parallel conformation. The different colors indicate the monomers. (C) Time evolution of distance between C-terminal ends dC-C. For each system, eight simulations were performed initiated from different starting velocities. The labels contain the following information: ap indicates antiparallel conformation and p indicates parallel conformation. The label wt indicates that the wild-type sequence was used, and C21S indicates that cysteine at position 21 was replaced by a serine. The range indicates the residues included in the simulations. The lines show a running average of 100 ps. The actual distances were calculated every 2 ps.