Figure 2.
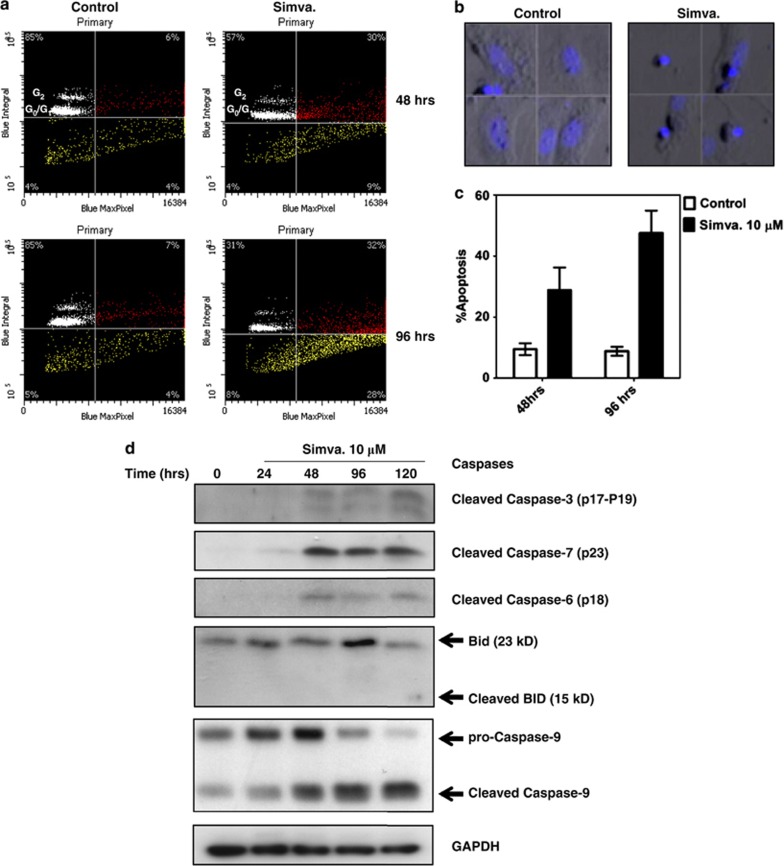
Mevalonate cascade inhibition stimulates intrinsic caspase-dependent apoptosis in primary myocardial atrial fibroblast. (a) Examples of typical scattergrams obtained by LSC of myocardial fibroblast cells treated with vehicle control or 10 μM simvastatin for 48 and 96 h. y axis data represent total integrated fluorescence of individual events (nuclei) and x axis shows maximum pixel fluorescence intensity within each event contour. Horizontal axis in each scattergram represents the threshold determined for reliable event identification, and the vertical line represents the outer boundary for normal cell pixel intensity (determined from control data). The position of cells with diploid or tetraploid nuclear DNA, representing G0/G1 or G2 cell cycle phase, is indicated in each scattergram. Percentages shown in upper quadrants indicate the mean % of cells determined from three separate experiments. Event frequency from color-coded ROI's from scattergrams are used to populate the histogram in panel 2c (below). Color-coding: White region represents healthy cells with integrated (2 N or 4 N) nuclear fluorescence in the G0/G1 and G2 phase of the cell cycle; Red region represent cells in which nuclear condenstation has occurred, and likely represent cells in early apoptosis (shifted right on X-axis for maximum pixel nuclear flurescence); and, Yellow region represents cells with reduced integrated nuclear fluorescence (DNA cleavage), and includes cells that exhibit more advanced apoptosis (increasing DNA cleavage and loss of DNS condensation), that correspond to a subG0/G1 population. (b) Galleries of images for individual cells representing events for ‘healthy' hATF (from the white color-coded region in a) and simvastatin-treated (10 μM, 96 h) ‘early apoptotic' cells G0/G1 cells (from the red color-coded region in a). (c) Histogram summarizing % apoptosis of cells extracted from LSC scattergrams of control and simvastatin-treated hATF (10 μM, 96 h). Apoptotic cell counts included the sum of hATFs from both the red and yellow colored regions of scattergrams (e.g. a). Results represent three different independent experiments in two different sets of primary atrial fibroblast. (d) Immunoblot BID, cleaved caspase-3, -6, -9 and -7 in total cell lysates of primary myocardial fibroblast. Cells were treated with simvastatin (10 μM) for up to 120 h. Arrows indicate positions and approximate molecular weight of predicted and visible protein signals. For all lanes GAPDH was used as protein loading control. Blots are typical of three experiments completed using different patient cultures of atrial fibroblast

