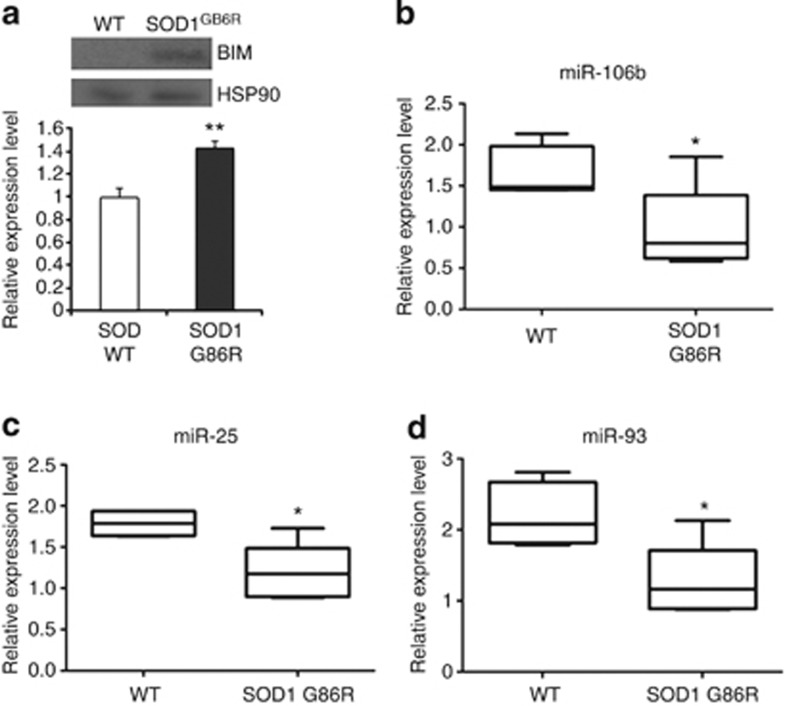
Figure 7.
Downregulation of miRNAs belonging to miR-106b-25 cluster in the SOD1 mutant mice. (a) The total protein was isolated from the cortex of WT and symptomatic SOD1G86R mice. A total of 40 μg protein per sample used for immunoblotting was analyzed using antibodies against Bim and HSP90. Upper panel, western blot analysis of Bim expression in cortex of WT and symptomatic SOD1G86R mice. Lower panel, average of Bim expression in the cortex of WT (n=2) and symptomatic SOD1G86R (n=7) mice are shown and error bars represent mean±S.D. (**P<0.05, two-tailed unpaired t-test as compared with WT mice). (b–d) The total RNA was isolated from the cortex of WT and symptomatic SOD1G86R mice and expression levels of miR-106b, miR-93, and miR-25 were quantified by real-time RT-PCR, normalizing against U6 snRNA. Box plots showing median and distribution of miR-106b (b), miR-25, (c) and miR-93 (d) in the cortex of WT (n=6) and symptomatic SOD1G86R (n=6) mice are shown. (*P<0.05, Wilcoxon signed rank test as compared with WT mice)

