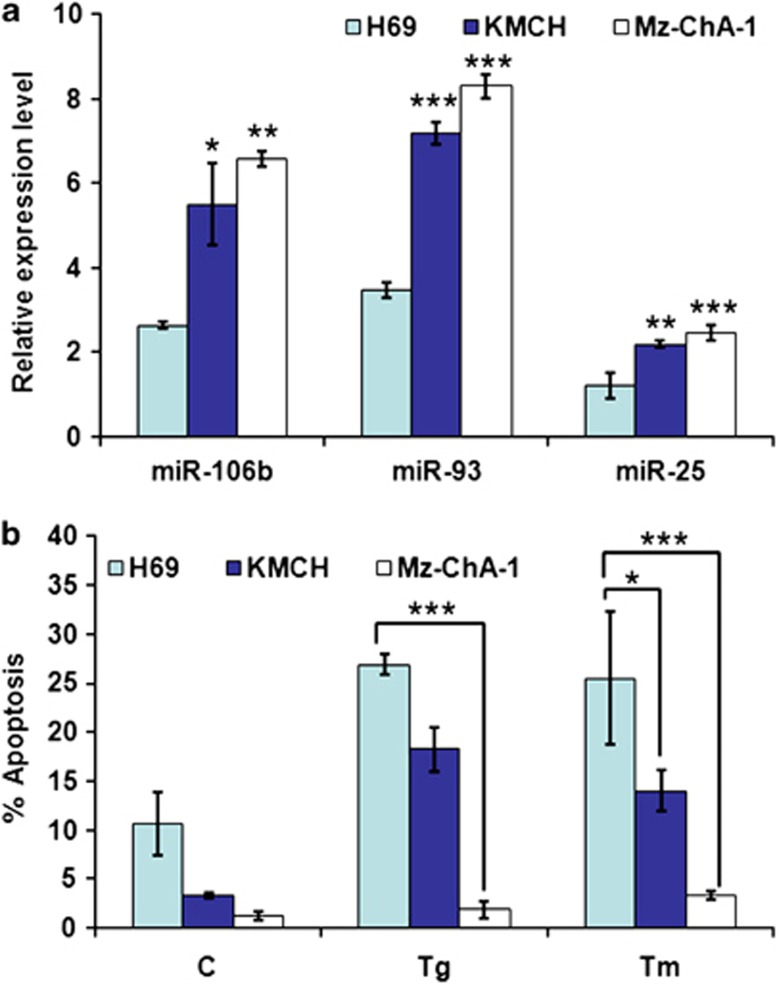
Figure 8.
Effect of miR-106b-25 expression on sensitivity to ER stress-induced cell death. (a) The expression of miR-106b-25 cluster members was measured by qRT-PCR from total RNA isolated from lysates of the indicated cell lines. Results are presented as relative expression using Z30 as an internal control and employing the delta-delta Ct method. Error bars represent mean±S.E. from three independent experiments performed in triplicate. Statistical significance was determined by ANOVA with Bonferroni post hoc correction; *P<0.05, **P<0.01, ***P<0.001, compared with H69 cells. (b) Indicated cell lines were treated with (2.0 μM) Tg and (2.0 μg/ml) Tm for 24 h. After treatment the apoptotic nuclei were determined as described in Materials and Methods section. Error bars represent mean±S.E. from three independent experiments performed in triplicate. Statistical significance was determined by ANOVA with Bonferroni post hoc correction; *P<0.05, **P<0.01, ***P<0.001, compared with H69 cells

