
Figure 6.
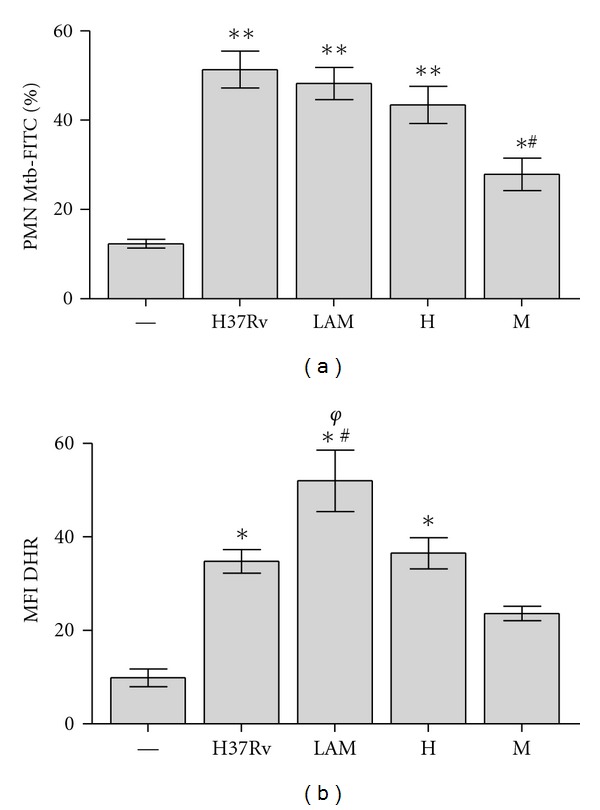
Phagocytosis of Mtb strains by PMN (a) As direct measure of phagocytosis, PMN were incubated with FITC-labeled Mtb (ratio 10 : 1). Then all Mtb-FITC bound/not ingested by PMN were quenched with Trypan Blue. Results represents bound/ingested plus ingested and are expressed as media ± SEM of MFI (n = 10). Statistical differences: Control (—) versus H37Rv, LAM and H: **P < 0.001 control versus M *P < 0.05; M versus other strains # P < 0.001. (b) Phagocytosis was indirectly measured by ROS production induced with DHR labeled Mtb (DHRMtb). PMN were incubated with DHRMtb (50 : 1 ratio) for 90 min. at 37°C and 123rhodhamine emission was evaluated immediatly in a flow cytometer. Results are expressed as media ± SEM of MFI (n = 10). Statistical differences: control (–) versus H37Rv, LAM and H: *P < 0.001; LAM versus H37Rv and H # P < 0.05; LAM versus M φ P < 0.001. In all cases PMN were washed, and 10,000 events were collected in a flow cytometer as described in Section 2.