
Figure 1.
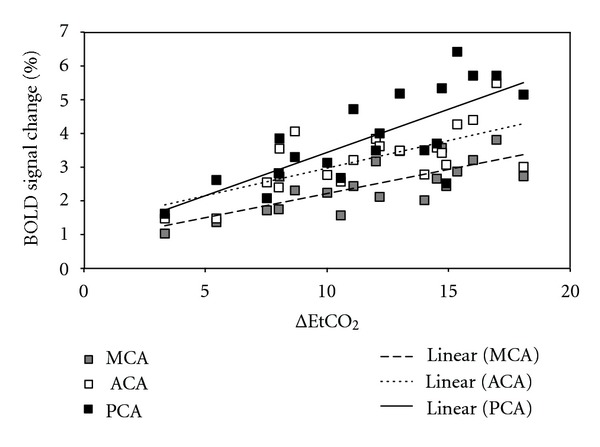
Linear correlation between BOLD signal change and ΔEtCO2 in brain regions supplied by the three main cerebral arteries (anterior: ACA, middle: MCA, and posterior: PCA), for a group of healthy subjects who underwent CO2 inhalation (r 2 = 0.73 ± 0.04). Note that the highest increases in BOLD signal were observed in region areas supplies by the posterior cerebral artery (PCA: black squares), and that the lowest BOLD signal amplitudes were observed in areas supplied by the middle cerebral artery (MCA: gray squares).