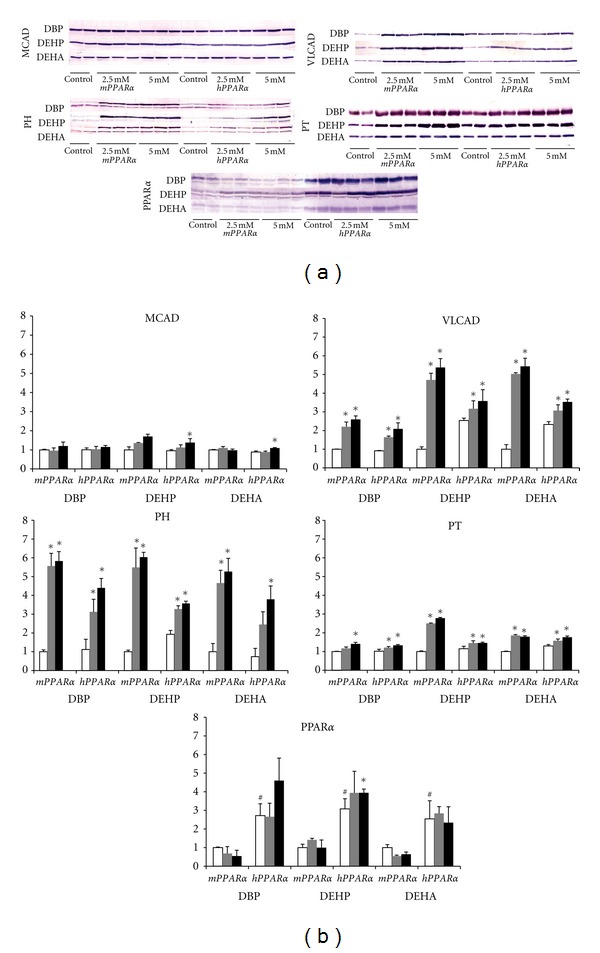
Figure 3.

(a) Western blotting analysis of hepatic PPARα and related genes. All mice from each treatment and genotype were examined across two gels, one of which is shown here. (b) Western blotting analysis of hepatic PPARα and related genes. Each band was quantified by densitometric analysis as described in Materials and Methods, and mean strength of control in mPPARα mice was assigned a value of 1.0. White, gray, and black columns represent control values, 2.5 mM- and 5.0 mM-treated group, respectively. Each column and bar represents mean ± S.D., respectively. *Significantly different from respective controls (P < 0.05). #Significantly different among genotypes (P < 0.05).
