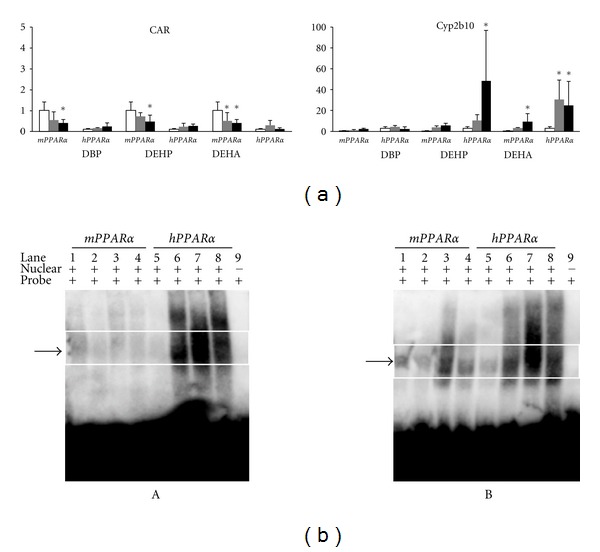
Figure 4.

(a) Effects on hepatic expressions of CAR and Cyp2b10-mRNA levels. Each mRNA level was normalized to the level of GAPDH mRNA in the same preparation, and the mean of the control group in wild-type (mPPARα) mice was assigned a value of 1.0. White, gray and black columns represent control values, 2.5 mM- and 5.0 mM-treated group, respectively. Values are expressed as mean ± S.D. *Significantly different from respective control group (P < 0.05). (b) Electrophoresis mobility shift assays of CAR-NR-1 (A) and CAR-NR-2 (B) complexes in liver nuclear fraction from control or treated-mPPARα (wild-type) and hPPARα mice. Lanes 1 and 5, control of wild-type, respectively; lanes 2 and 6, wild-type and hPPARα mice treated with 5.0 mM DBP, respectively; lanes 3 and lane 7, wild-type and hPPARα mice treated with 5.0 mM DEHP, respectively; lanes 4 and lane 8, wild-type and hPPARα mice treated with 5.0 mM DEHA, respectively; lane 9, oligonucleotide for NR-1 or NR-2 only. Arrows indicate the shifted CAR-NR complex.
