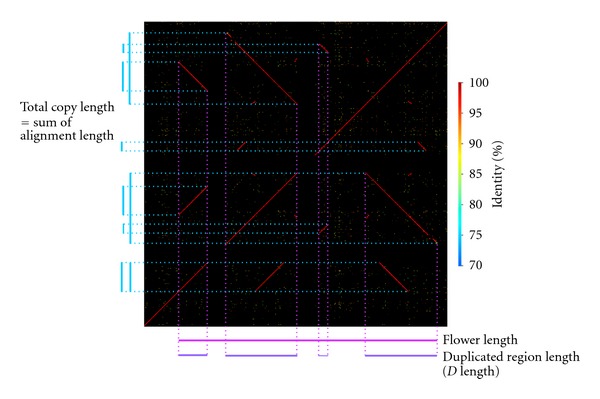
Figure 1.

Example of a Flower. A dot plot shows an example of a Flower located on chromosome 10. Diagonal lines in the plot indicate the positions of blast hits, and the colors of the lines represent the identity of alignments as shown in the right-hand side of the plot. A blue bar indicates a detected copy unit, and the sum of alignments of blast hits equals the sum of the copy length. A pink bar indicates a Flower region, and the length of the bar represents the length of the Flower. A purple bar indicates a region called the duplicated region that contains the copy.
