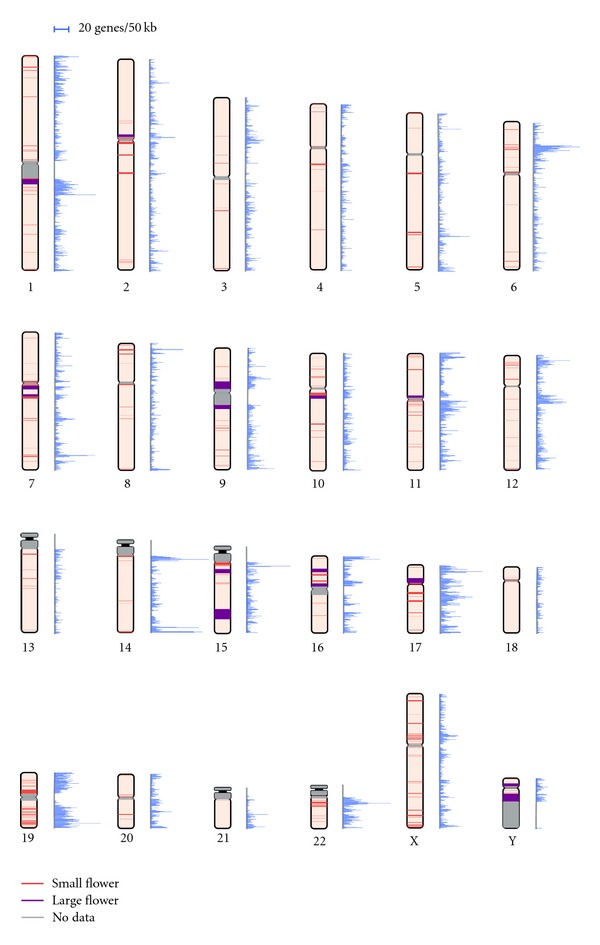
Figure 2.

Distribution of Flowers and gene density on chromosomes. A bar on a chromosome denotes the position of a Flower and the width of the bar represents the Flower length. The color of the bar represents the patterns of Flowers: small (red) and large (purple) Flowers. Gray bars stand for no genomic sequence data. Mapping of the bars was accomplished using ColoredChromosomes [11]. Gene density is represented alongside each chromosome. The scale for the gene density is placed at the top of the figure.
