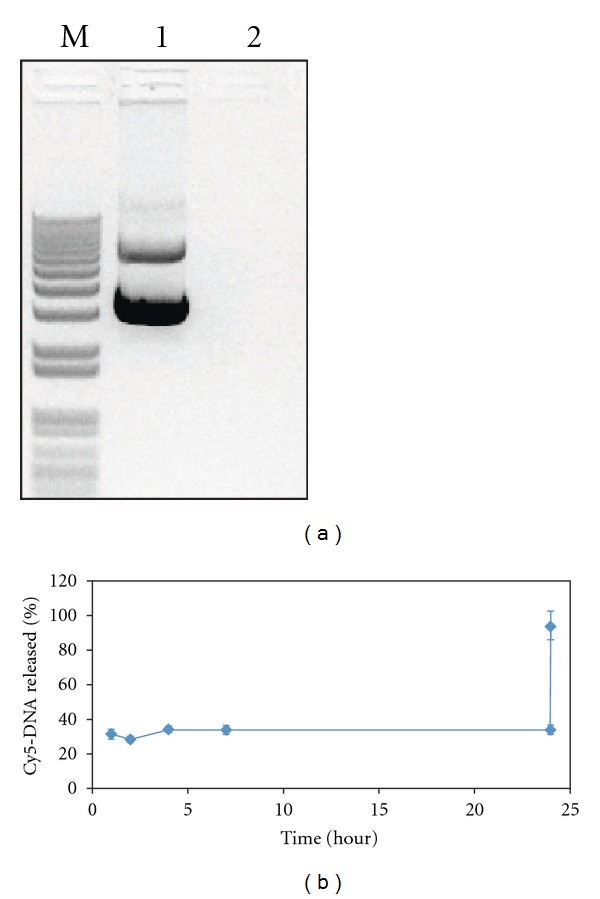
Figure 2.

DNA encapsulation efficiency and release study. (a) DNA encapsulation efficiency was analyzed by comparing band intensity of control DNA (lane 1) to that of nonencapsulated DNA collected during the tangential flow filtration process (lane 2). (b) Cy5 fluorescence of released DNA from nanoparticles in buffer pH 7.4 over 24 hours followed by addition of pH 5 buffer. The pH changes to 5 at 24 hours.
