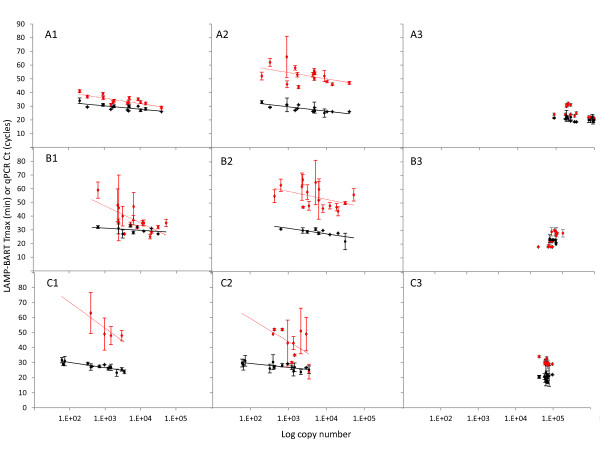
Figure 3.
Influence of the DNA extraction method on RT-PCR and LAMP-BART efficiency. LAMP-BART (red points) and RT-PCR (black points) standard curves made by serial dilutions of DNA isolated using Promega's Genome Wizard kit (A), the Nucleon Phytopure Kit (B) or the CTAB-homebrew method (C; diluted 10 fold to reduce inhibitory nature of this preparation). DNA isolated using each extraction technique was amplified with the CaMV 35 S-p (1), NOS-t (2) or ADH1 (3) primer sets. Template concentration in LAMP-BART comparisons are plotted as a function of time to light peak (Tmax), while RT-PCR comparisons are based on cycle number (Ct). Each RT-PCR cycle is approximately equivalent to 2 min.

