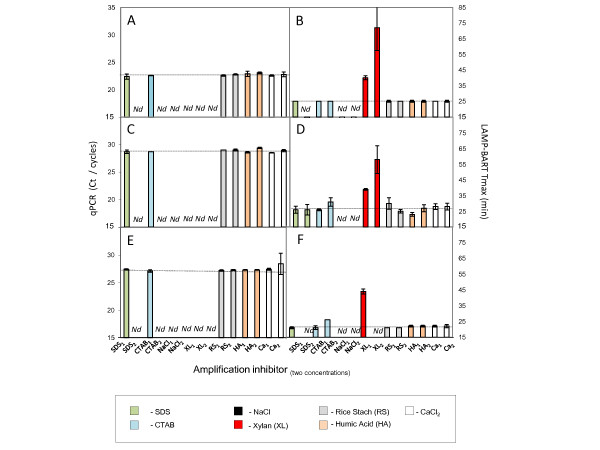
Figure 4.
Comparison of inhibitors of PCR and LAMP-BART. Bt11 maize genomic DNA samples (5% GM) were subjected to RT-PCR amplification using ADH1 primers (A); CaMV 35 S-p primers (C) or NOS-t primers (E). A comparative set of analysis was performed using LAMP-BART, conducted in the presence of ADH1 primers (B); CaMV 35 S-p primers (D) or NOS-t primers (F). The extracted sample contained either 105 copies of wild type genome or 5 × 10³ copies of transgenic genome. The analysis was performed in the presence and absence of final inhibitor concentration defined: sodium dodecyl sulphate; (SDS; 0.005% [1]; 0.01% [2] – GREEN BARS); cetyl trimethylamonium bromide (CTAB; 0.005% [1]; 0.01% [2] – BLUE BARS); sodium chloride (NaCl; 25mM [1]; 50mM [2]- BLACK BARS); xylan (XL; 0.1% [1]; 0.25% [2] – RED BARS); rice starch (RS; 0.1% [1]; 0.25% [2] – GREY BARS); humic acid (HA; 0.01ng [1]; 0.1ng [2] – BROWN BARS); calcium chloride (CaCl2; (1µM [1]; 100µM [2] – WHITE BARS). The broken line (----------), represents the average Ct or Tmax value for each set of amplifications performed in the absence of inhibitor. In some instances amplification or reporting of this activity was completely inhibited (not determined; Nd).

