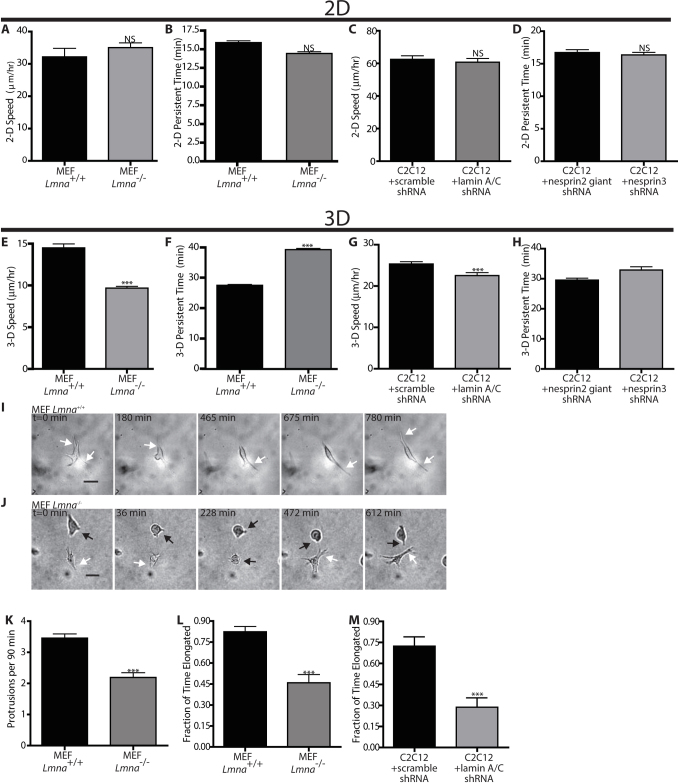
Figure 1. Lamin deficiency modulates cell motility and morphology when cells are embedded in a 3D matrix, not on planar substrates.
(A) and (B). Averaged speed (A) and persistence time of migration (B) of individual Mouse Embryonic Fibroblast (MEF) Lmna+/+ and Lmna−/− cells placed on collagen I-coated 2D substrates. Persistence time is the averaged time it takes for the direction of cell motility to become de-correlated. (C) and (D). Averaged speed (C) and persistence time of migration (D) of individual MEF Lmna+/+ and Lmna−/− cells inside a 3D collagen I matrix. (E) and (F). Averaged speed (E) and persistence time of migration (F) of individual mouse myoblasts (C2C12) transfected with scrambled shRNA or shRNA-depleted of lamin A/C inside a 3D collagen matrix. (G) and (H). Typical time-dependent overall morphology of Lmna+/+ (G) and Lmna−/− (H) MEFs embedded inside a collagen matrix. While arrows point to elongated morphology, black arrows point to rounded morphology. Scale bar, 20 μm. (I). Averaged number of actively growing membrane protrusions per cell per 90 min measured under high-magnification phase-contrast microscopy. Protrusions are deemed active when they are associated with significant traction of the matrix in their vicinity. Protrusion remnants at the rear end of motile cells are not counted. (J) and (K). Fraction of the time when cellular morphology of MEFs (A) or C2C12s (B) with or without lamin A/C is elongated as opposed to rounded up or collapsed. N = 10 cells per type of cell in triplicate for a total of 30 cells for each condition. Measurements in panels A–D, I and J are mean ± SEM. (***): P<0.001 (student t-test; N = 33 cells in triplicate for a total of 99 cells for each condition). Measurements in panels E, F, and K are mean ± SEM. (***): P<0.001 (one way ANOVA test; N = 33 cells in triplicate for a total of 99 cells).

