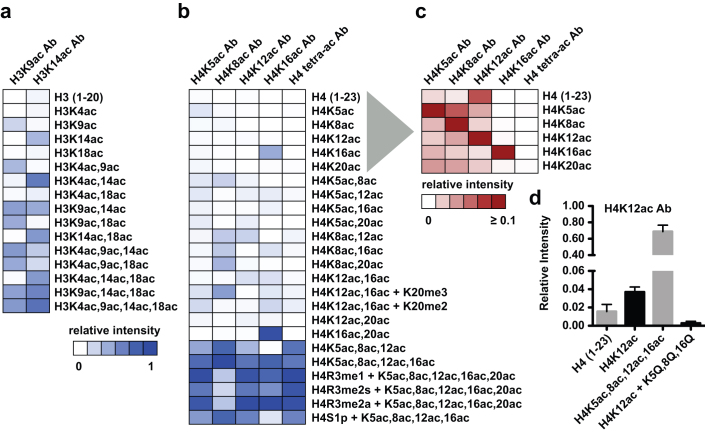
Figure 1.
(a-c) Heat maps summarizing peptide array results for H3 and H4 acetyl antibodies.For each array, the most intense series of peptide spots (12 individual spots per peptide) is assigned a value of 1 (blue), and all values are normalized to this peptide. Values ≥ 0.1 are colored red in panel C to enable interpretation of low signal intensities. Each interaction is presented as an averaged normalized intensity from at least two independent arrays (r2 > 0.9). See Rothbart et al16 for details of the array methodology. Antibody information can be found in Supplemental Table 2. While one antibody for each histone PTM is shown in the figure for representation, other antibodies tested to the same PTMs showed similar findings (Supplemental Table 2).(d) Normalized array signal intensities for H4K12ac antibody binding to the indicated peptides. Values are presented as an average of 24 individual spots (2 arrays) ± s.e.m.

