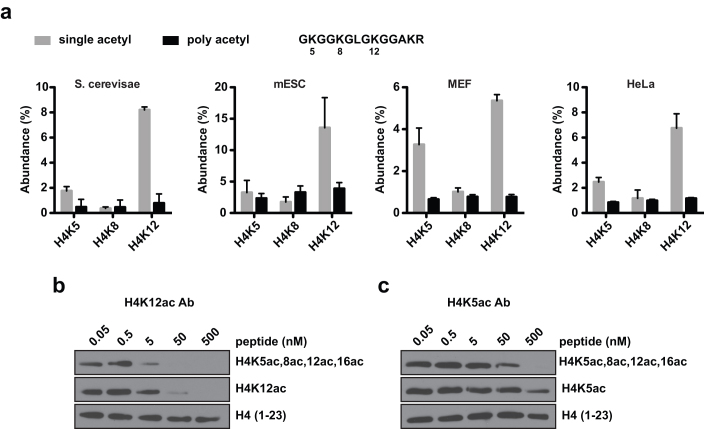
Figure 2.
(a) Quantitative mass spectrometry to determine the distribution of single- and poly-acetylation of the indicated H4 peptide across species.Poly-ac is represented as a summation of 2 or more acetylations in the context of the single mark. A complete analysis is shown in Supplemental Fig. 3. (b-c) Western blots of HeLa chromatin extracts following antibody incubation with the indicated concentrations of competing peptide.

