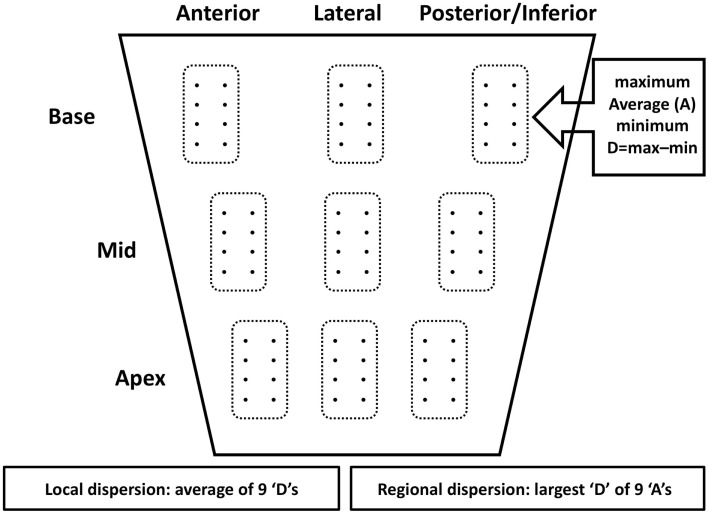
Figure 1.
Schematic presentation of location of the multigrid electrode. It consisted of eight (4 × 2) terminals separated 0.5 and 1 cm respectively. In each of nine regions that were successively (and randomly) assessed maximum, average (A), minimum, and dispersion (D: maximum minus minimum) were determined for activation times, activation-recovery intervals and repolarization times. Local dispersion was defined as the average of the 9 “D” values. Regional dispersion was defined as the difference between the largest and smallest “A” (see Materials and Methods for further explanation).

