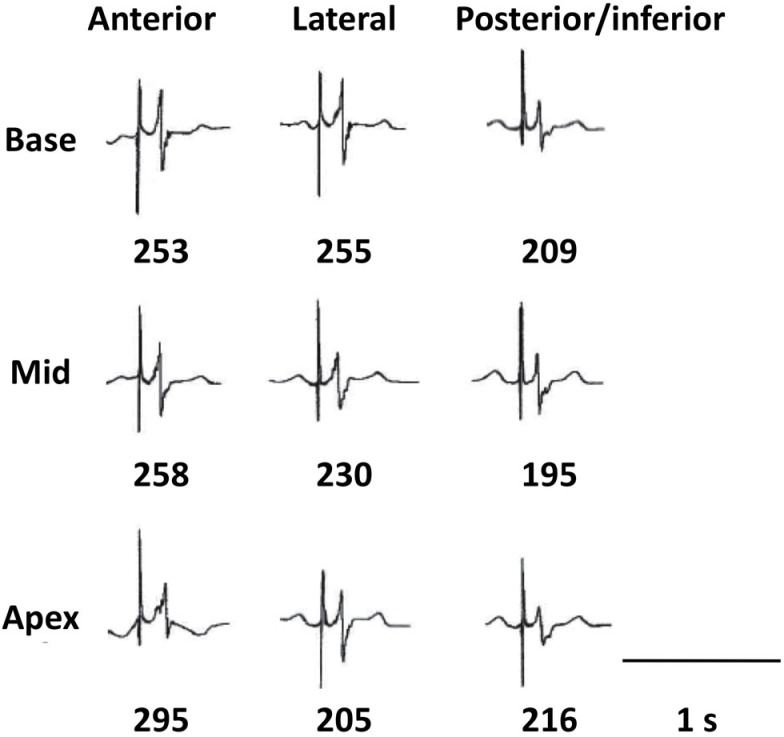
Figure 2.
Local electrograms at the nine positions in one of the patients. The first vertical line indicates the stimulus artifact. The number below each of the nine positions is the local activation-recovery-interval (ARI), measured from dV/dtmin of the QRS till dV/dtmax of the T wave (see Materials and Methods).

