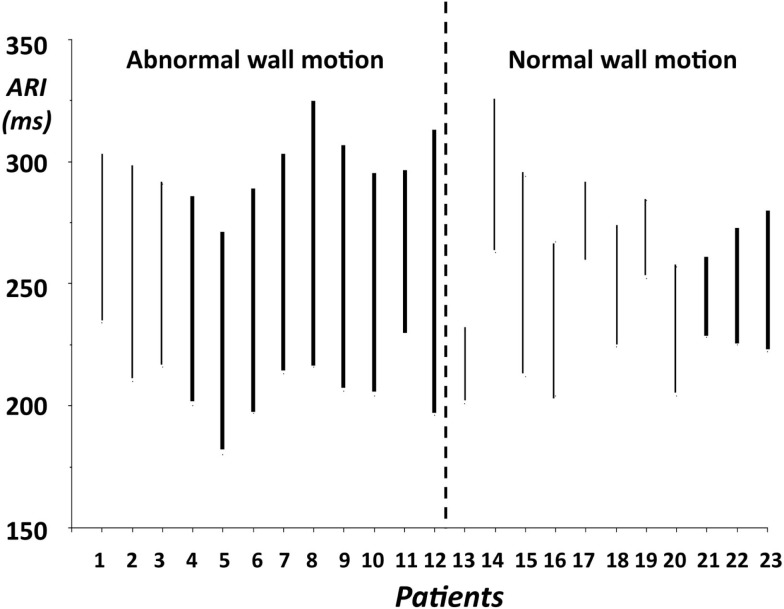
Figure 3.
Minimum and maximum activation-recovery intervals (ARIs) in 23 patients (1–12 with WMA, 13–23 with normal wall motion; patient groups separated by dashed line between patients 12 and 13). Thin lines: patients without myocardial infarction, bold lines: patients with myocardial infarction. Whether patients had normal wall motion, or were hypokinetic, akinetic, or dyskinetic can be found in Table 2, where the order of the patients is similar to that in Figure 3.

