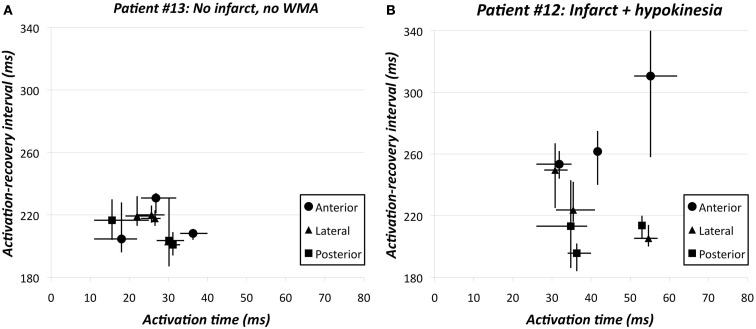
Figure 8.
(A) Activation time vs. activation-recovery intervals in the nine regions of patient #13 (see also Figure 3; Table 2). Y = −0.39 X + 224; r = −0.256, ns. Thin lines indicate dispersion in activation times and activation-recovery intervals in each of the nine regions. (B) Activation time vs. activation-recovery intervals in the nine regions of patient #12 (see also Figure 3; Table 2). Y = 0.60 X + 211; r = 0.168, ns. Thin lines indicate dispersion in activation times and activation-recovery intervals in each of the nine regions. The huge dispersion primarily results from the very long activation-recovery intervals in the apical anterior region. The three posterior/inferior regions were all hypokinetic, leading to wall motion score 3 in this patient. The posterior/mid region had the shortest activation-recovery intervals.

