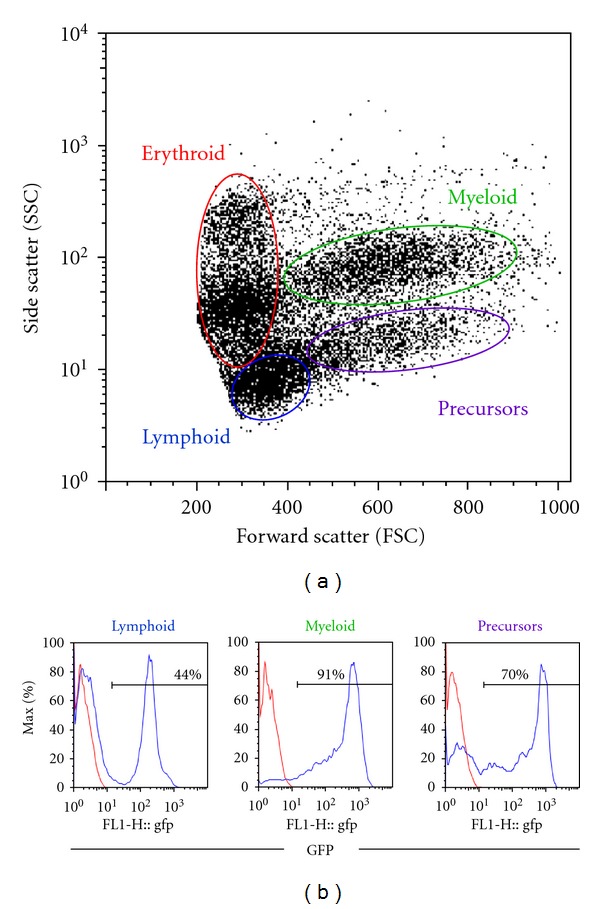
Figure 1.

Flow cytometry analysis of zebrafish whole kidney marrow from a marrow transplant recipient. Zebrafish transplant recipients were irradiated and injected with 5 × 10⁵ marrow cells from a transgenic β-actin:GFP donor. Whole kidney marrow from a representative recipient was dissected 3 months later and analyzed by flow cytometry. (a) The forward scatter (FSC) versus side scatter (SSC) profile of zebrafish whole kidney marrow shows four cell populations: erythroid, lymphoid, myeloid, and precursor cells. (b) Histograms for GFP expression of cells within the lymphoid, myeloid and precursor gates show multilineage engraftment with GFP+ donor cells (blue lines). The red lines show GFP expression in a wild-type-negative control fish.
