Figure 1.

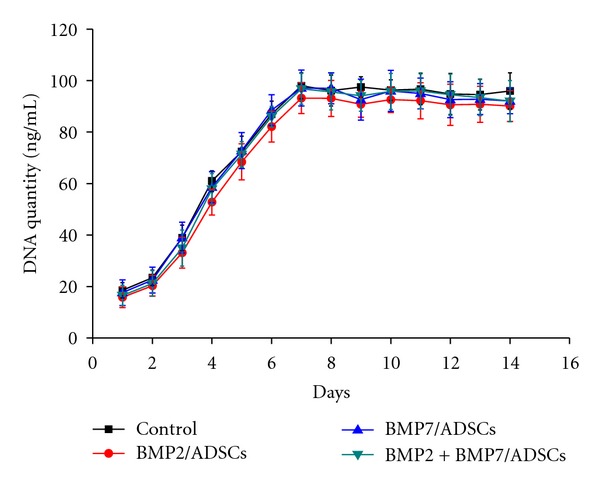
The proliferation curves of control group, BMP2/ADSCs group, BMP7/ADSCs group, and BMP2 + BMP7/ADSCs group on the β-TCP scaffolds for two weeks after cell seeding. Results are shown as mean ± SD (n = 3 for each group).

The proliferation curves of control group, BMP2/ADSCs group, BMP7/ADSCs group, and BMP2 + BMP7/ADSCs group on the β-TCP scaffolds for two weeks after cell seeding. Results are shown as mean ± SD (n = 3 for each group).