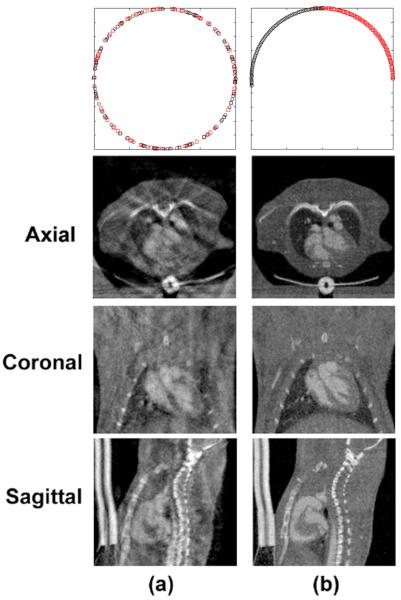
Fig. 6.
Reconstructed micro-CT images shown in axial, coronal, and sagittal orientations. The images were generated with different gating strategies, RG (a) and FPG (b). The first row illustrates the angular distributions of the projections for each gating strategy, where each projection is represented as a circle or square and color-coded in black and red for the two imaging chains. In this set, RG acquired 202 projections, while FPG acquired 160 projections at this phase (0% of RR interval).

