
Figure 2.
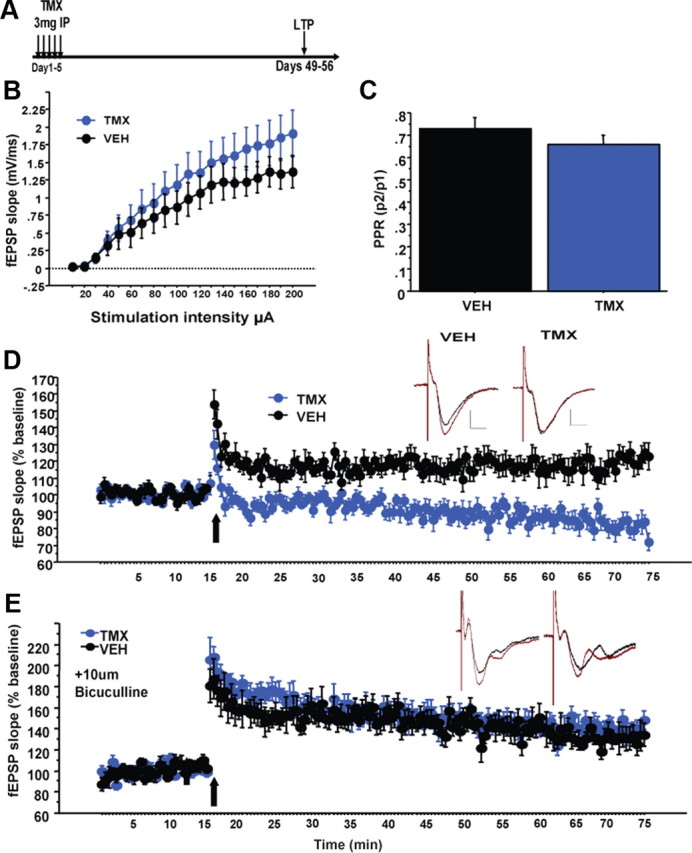
Impaired ACSF-LTP in the DG of iNR2BNes mice. A, Experimental timeline for electrophysiology experiments. B, C, No differences in input–output relationship (B) or paired-pulse depression (C; paired-pulse ratio (PPR), 50 ms interstimulus interval) of MPP inputs to the DG after deletion of NR2B. D, Significantly impaired ACSF-LTP in slices from iNR2BNes mice compared with controls. Inset, Representative average traces before and after HFS. Scale bars: verticle, 0.5 mV; horizontal, 5 ms. E, No difference in magnitude of LTP in slices in the presence of 10 μm bicuculline. Data are mean ± SEM.