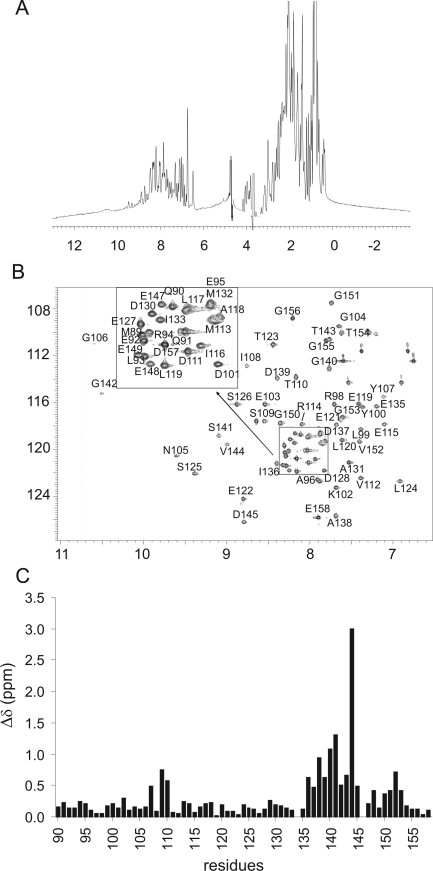
Figure 2.
NMR analysis of apo F1 CTnC and comparison with the spectrum of the holo form. (A) 1D spectrum and (B) assigned 15N−1H HSQC spectra of apo F1. (C) Averaged chemical shift perturbation {Δ = [(δN/10)2 + (δH)2]1/2} as a function of sequence. The spectra were recorded on an INOVA spectrometer operating at 600 MHz.

