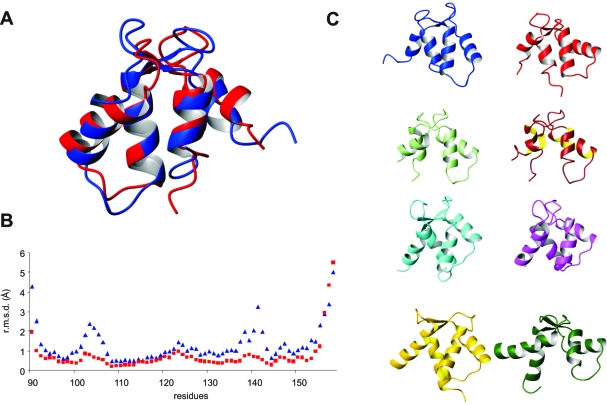
Figure 4.
Structural comparison. (A) Structural superposition of apo (blue) and holo (red) F1 CTnC using regions of maximal similarity according to DaliLite (http://www.ebi.ac.uk/Tools/dalilite/index.html). (B) Comparison of the rmsd values of the atomic coordinates in the bundles vs the sequence. The blue curve refers to apo F1 CTnC and the red curve to the holo F1 CTnC as obtained from the bundle of full-length F1 TnC coordinates. (C) Structures of different TnCs available both in the apo form and in the holo form. We show from left to right and from top to bottom the following: apo F1 CTnC (PDB entry 2k2a, blue), holo CTnC (PDB entry 2jnf, red), apo skCtnC in a complex with TnI and TnT (PDB entry 1yv0, light green), holo skCtnC in a complex with TnI and TnT (PDB entry 1ytz, brown), apo cNTnC (PDB entry 1spy, cyan), holo cNTnC (PDB entry 1apo, magenta), apo skNTnC (PDB entry 1tnp, gold), and holo skNTnC (PDB entry 1tnq, dark green). The structures were superposed on helices I and II and then displaced for the sake of clarity. The orientation chosen differs by approximately 180° from those in panel A.

