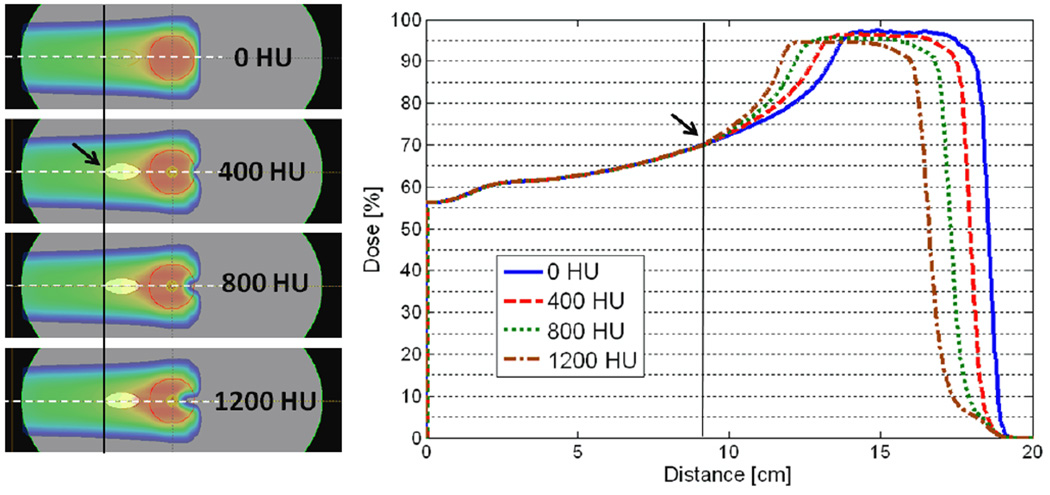
Figure 1.
An oval shaped heterogeneity was inserted in the beam path to simulate anatomical changes. The density of the object varied from 0 HU to 1200 HU in increments of 400 HU. The line dose profiles beyond the start location of heterogeneity (indicated by the arrow) are pulled proximally towards the source as the density of the hetergeneity increases according to the effective change in the WEPL while the rest of the profile proximal to the heterogeneity remains approximately the same.

