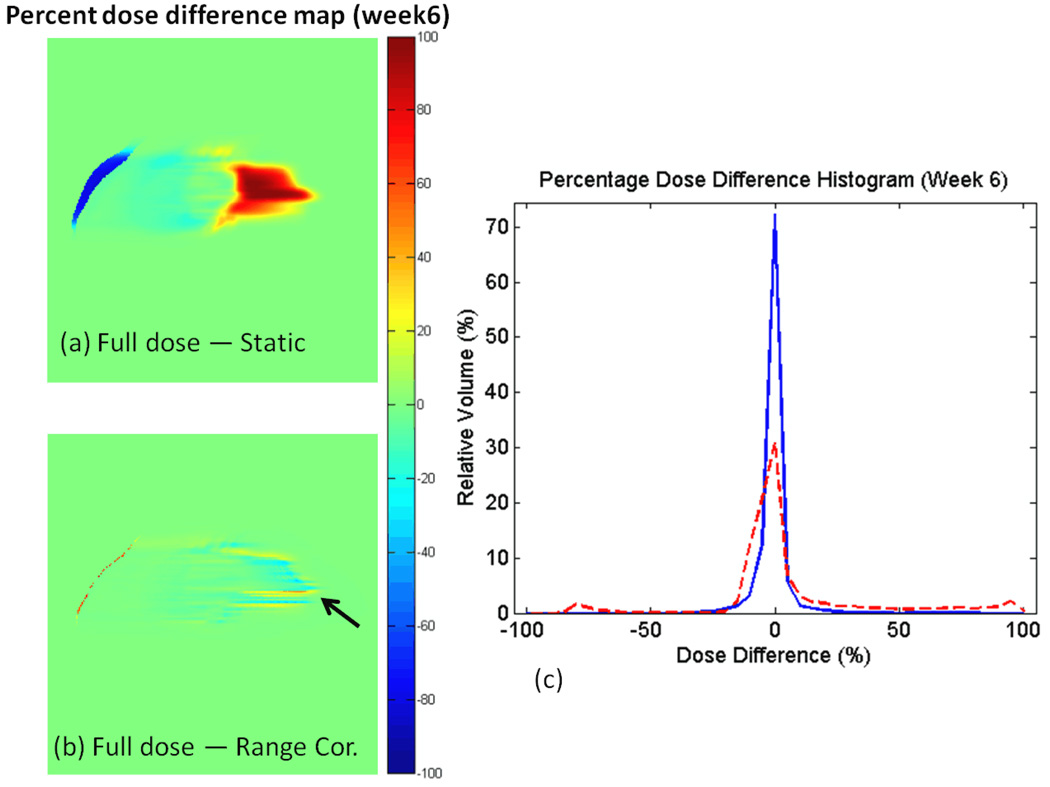
Figure 3.
The percent dose difference map on the lung week6 CT between dose distribution using full calculation and dose distribution using (a) static dose approximation, (b) range corrected approximation, and (c) the percentage dose difference histograms for the two difference maps. Red dashed line in the histogram is derived from (a) while blue solid line is derived from (b).

