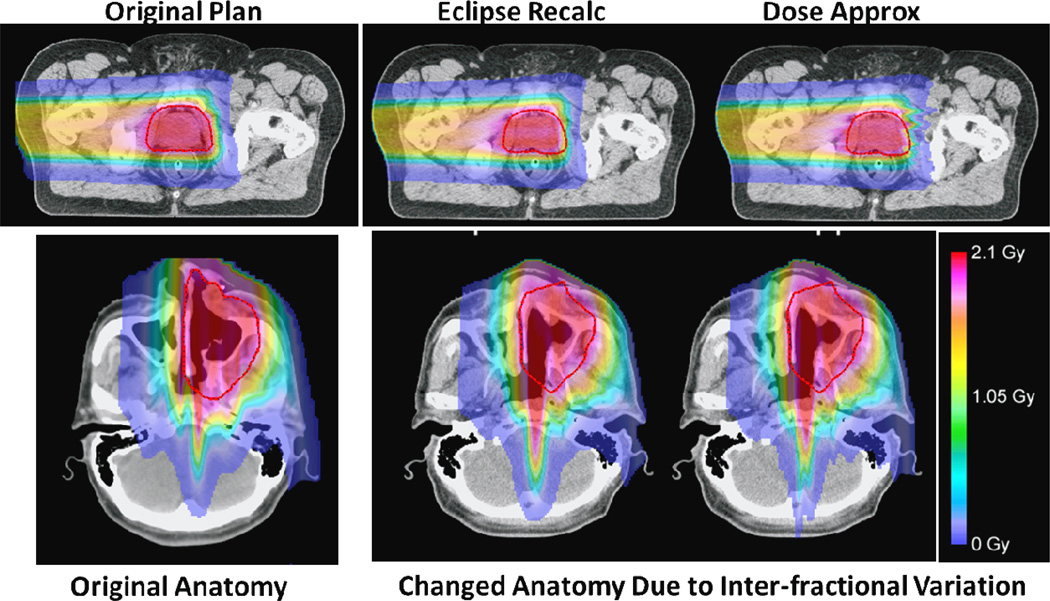
Figure 4.
A comparison of the dose calculation results in the presence of inter-fraction anatomical changes. The original plan and original anatomy for a prostate case (top row) and a HN case (bottom row) are shown to the left column. The dose distributions for the changed anatomy calculated by the commercial treatment planning system (Eclipse, Varian Medical Systems) are shown in the middle column, and the dose distributions calculated by the range-corrected dose approximate method are shown to the right, respectively.

