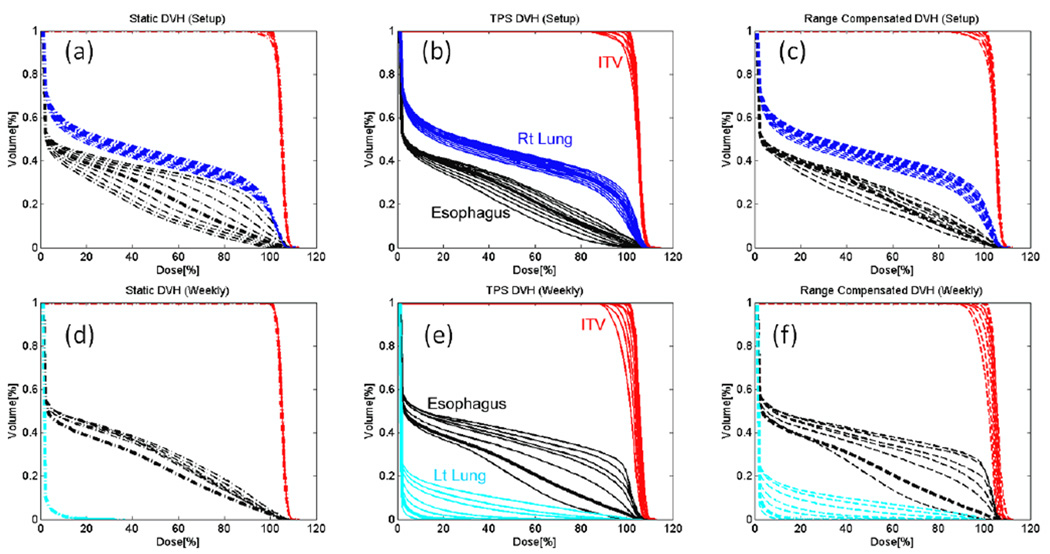
Figure 5.
The cDVHs of the CTV (red), involved lung (dark blue), contralateral lung (light blue), and esophagus (black) derived from realized dose distributions under various setup error (top row) and weekly imaging (bottom row) using static approximation (a, d), full dose calculation (b, e), and range-corrected approximation methods (c, f). The thicker lines indicate original DVHs derived from the planned dose distribution.

