
Figure 3. Mapping hES cell behavior to polymer properties using primary arrays.
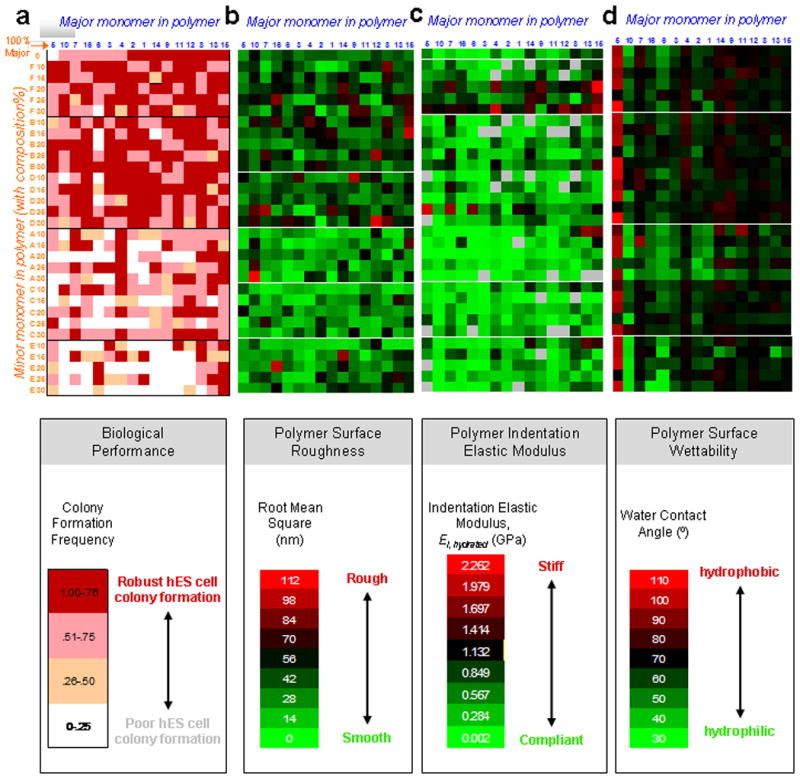
a, Map of hES cell colony formation and polymer composition for all of the 496 monomer combinations in the primary array. For the minor and major composition axes, the numbers and letters indicate the major and minor monomer, respectively, as shown in Figure 1a. Major monomer are listed in order, from left to right, of increasing colony formation, while minor monomers are listed in order of increasing colony formation from bottom to top. Therefore, the region of the map corresponding to highest colony formation is the top right corner, while the region with the lowest is the bottom left corner. Homopolymers are listed at on the upper row. The frequency of colony formation on the primary polymer array was grouped into four categories 0-0.25, 0.25-0.50, 0.50-0.75, and 0.75-1.0 per polymeric spot, as indicated by the intensity of red. b, Surface roughness of primary array polymers coated with FBS in DMEM medium. Map indicating root mean square roughness (see colored legend below) for all of the 496 monomer combinations in the primary array. c, Indentation elastic modulus of primary array polymers hydrated in PBS. Map indicating indentation elastic modulus (see colored legend below) for all of the 496 monomer combinations in the primary array. Grey indicates no data obtained. d, Wettability of primary array polymers. Map indicating water contact angle (see colored legend below) for all of the 496 monomer combinations in the primary array. Note that polymers in the upper right corner of part a with higher colony formation frequencies (dark red) have moderate water contact angles (black) in the upper right corner of part d, whereas this region does not correlate to any specific ranges of roughness or elastic modulus in the upper right corner of parts b & c.