
Figure 4. Correlating hES cell behavior to polymer properties using primary arrays.
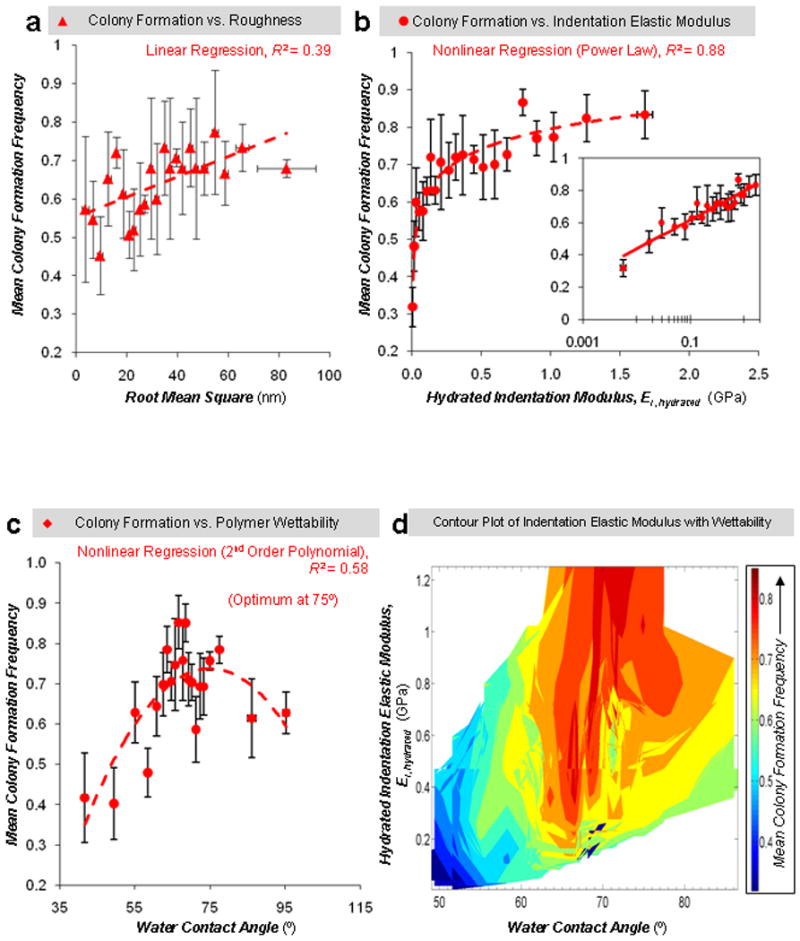
Using data in Figure 3, regression was performed for two properties listed at the top of each plot: colony formation vs. polymer roughness (a), colony formation vs. polymer indentation elastic modulus in the hydrated state (b), colony formation vs. wettability (c), and colony formation as a function of both polymer wettability and indentation elastic modulus in the hydrated state (d). After performing linear regression, 2nd order polynomial regression, and power law regression, only the regression with the highest R2 is shown in each plot (dashed line). Insets in parts b are in semi-log format to indicate behavior at low modulus values. Data is sorted into groups of 20-25 spots as a function of increasing WCA, roughness, or modulus. For contour plot, interpolation between data points (groups of 20-25 spots) was performed on Matlab (see methods). Abscissa error bars represent the standard error of the WCA, roughness, or modulus for a given group of 20-25 spots. In plots a, b, and c, ordinate error bars represent the standard error of the mean of the colony formation frequency of three replicates for a given group.