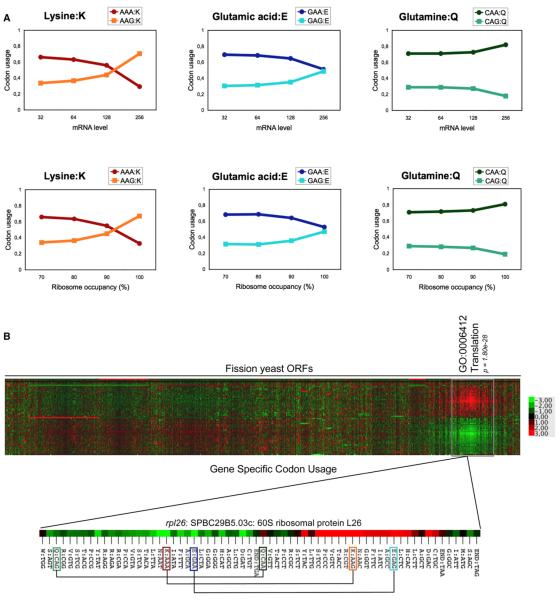
Figure 2. Highly Expressed Fission Yeast Genes Use a Skewed Codon Content Excluding the AAA and GAA Codons.
(A) Codon bias between G- and A-ending codons for lysine, glutamic acid, and glutamine in genes as a function of mRNA level (upper panel) or ribosome occupancy (lower panel). The data sets used are from a previous study (Lackner et al., 2007).
(B) Hierarchical clustering and heat map analysis of the gene-specific codon usage for each codon (rows) in each S. pombe ORF (column). Clustering was performed based on Z-scores shown in Table S1. Deviations from genome average are shown for each codon according to the color-code key. One main cluster is highlighted and is enriched for the “Translation” GO category that includes highly expressed genes. The codon usage of the rpl26 gene (rotated) exemplifies a skewed codon content for lysine and glutamic acid.

