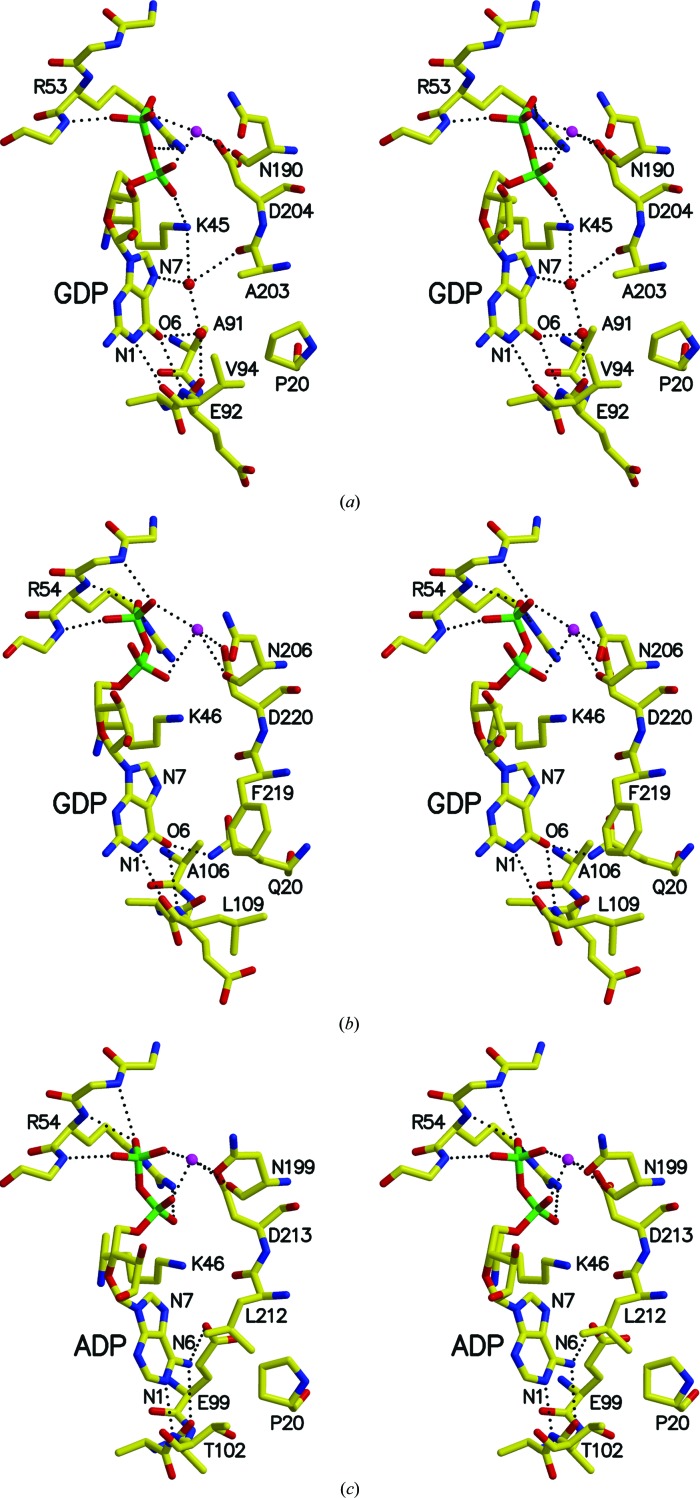
Figure 7.
Comparison of the nucleotide-binding sites of T. aquaticus, pig GTP-specific and E. coli SCS. (a) Interactions of T. aquaticus SCS with GDP-Mn2+. (b) Interactions of pig GTP-specific SCS with GDP-K+. (c) Interactions of E. coli SCS with ADP-Mg2+. Atoms are coloured as in Fig. 6 ▶, with the exception that either manganese, potassium or magnesium is shown in magenta. This figure and Fig. 8 ▶ were drawn using MolScript (Kraulis, 1991 ▶) and Raster3D (Merritt & Bacon, 1997 ▶).

