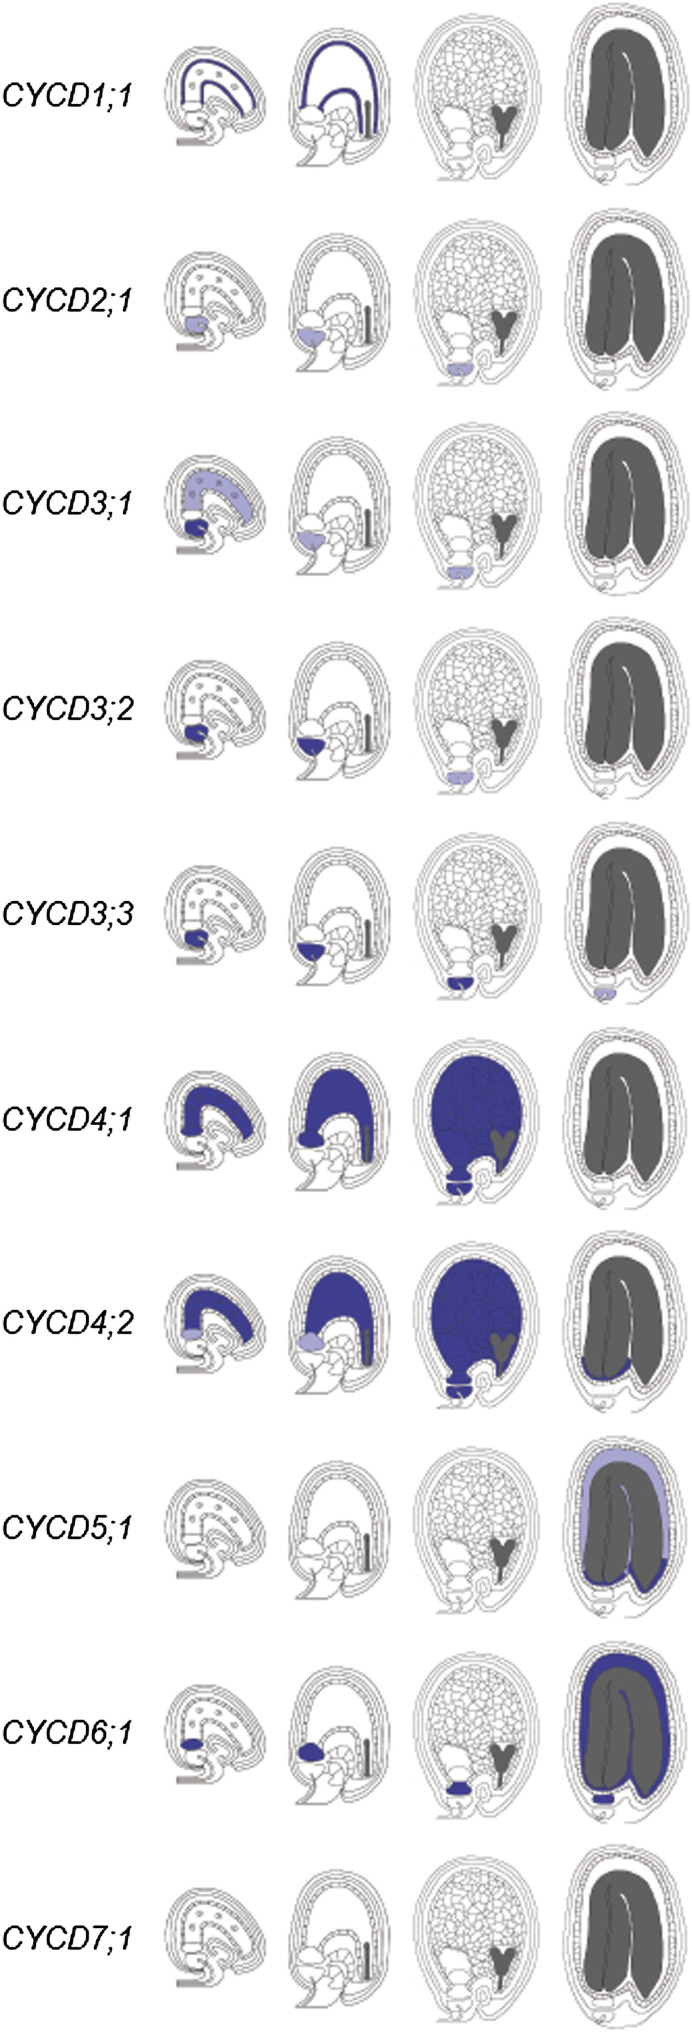
Fig. 4.
Summary of CYCD gene expression patterns during endosperm and peripheral seed tissue development using GUS reporters. Representative stages shown (from left to right): early syncytial, mid-syncytial, cellularized, and mature. Relative strengths of expression are represented as dark blue (strong), light blue (weak), and white (none).

